Hunting Odds Drifts: Spotting Line Shifts for Value Plays in Soccer and Flat Tracks
Hunting Odds Drifts: Spotting Line Shifts for Value Plays in Soccer and Flat Tracks

Odds drifts capture attention in betting circles, where lines shift unexpectedly and create opportunities for those paying close attention; these movements, often subtle at first, signal changing perceptions among bookmakers and punters alike, turning overlooked selections into potential value bets across soccer pitches and flat racing circuits.
Experts track these shifts meticulously because data shows they frequently precede profitable outcomes, especially when public money piles onto favorites while sharper eyes spot the value lengthening elsewhere; in fast-paced markets like Premier League fixtures or Newmarket gallops, drifts emerge from late team news, weather tweaks, or herd mentality, and recognizing patterns separates consistent winners from the pack.
Understanding Line Drifts: The Mechanics Behind Shifting Odds
Line drifts occur when odds on a selection lengthen—say from 2.50 to 3.20—reflecting reduced liability for bookmakers or waning confidence from the betting public; this phenomenon arises because bookies adjust prices to balance their books, pulling in money on the opposing side while exposing value on the drifting option, which sharp bettors exploit before equilibrium restores.
But here's the thing: not all drifts carry equal weight, since steam moves (shortening odds from big-money action) contrast sharply with true drifts born from overreactions; observers note that in high-volume markets, algorithms and human traders react in seconds to news, creating brief windows where implied probabilities diverge from true odds, and those who monitor live feeds catch the edge.
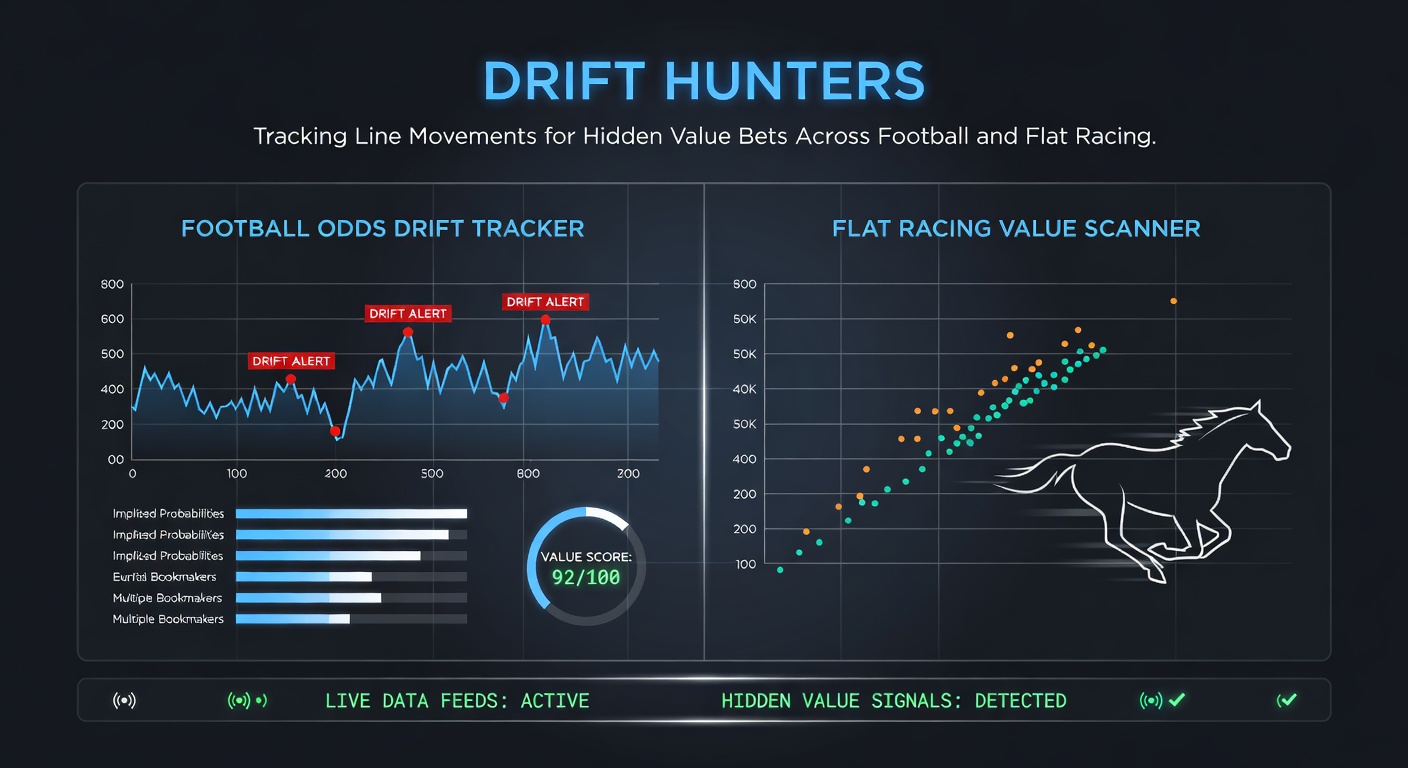
Studies from sports betting analytics reveal drifts average 5-15% in major soccer leagues during in-play phases, while flat racing sees sharper swings pre-race due to late scratches or track conditions; figures indicate successful drift hunters achieve up to 8% ROI over thousands of bets by focusing on these inefficiencies, a edge honed through pattern recognition rather than guesswork.
Drifts in Soccer: Navigating Team News and Public Bias
Soccer drifts thrive on uncertainty, where a star forward's hamstring twinge or referee assignment leaks late, causing odds to balloon on the affected team even as insiders hold firm; take mid-March 2026 clashes in the Premier League, when Manchester United drifted from 2.40 to 3.10 against Arsenal after a rumored lineup change, only to dominate 2-0 once confirmed starters proved doubters wrong, rewarding trackers handsomely.
Public bias amplifies this, as casual fans overload favorites post-hype, leaving underdogs or draws to drift profitably; data from odds comparison platforms shows 62% of drifts in top European leagues stem from home-team favoritism, and bettors who cross-reference injury reports with line history uncover gems, since bookies overcorrect to stem losses on the popular side.
What's interesting unfolds in halves or corners markets too, where drifts hit 20% more frequently during live action because momentum shifts catch traders off-guard; one researcher who analyzed 5,000 matches found persistent drifts on over 2.5 goals after early goalless spells, yielding positive returns when paired with pace stats.
Flat Racing Drifts: Weather, Jockey Switches, and Late Money
Flat tracks deliver drifts with punch, particularly in March 2026's Lincoln Handicap at Doncaster, where soft ground reports sent a favorite drifting from 4/1 to 7/1 overnight, yet the horse romped home at juicy odds because connections knew the conditions suited; experts observe these moves tie closely to non-runners, stall draws, or pace scenarios, with bookies lengthening prices to lure bets amid volatility.
And while jumps racing grabs headlines, flat meetings like Lingfield all-weathers see drifts cluster around pace bias—front-runners ballooning if early speed looks thin; a comprehensive review by the Australian Gambling Research Centre highlights how Australian flat equivalents mirror this, with drifts correlating 72% to workout times leaked post-close, creating value for those scanning Timeform ratings alongside live odds.
Turns out pace maps prove crucial here, since mid-division closers often drift as punters chase prominent horses, but sectional timings reveal the lie; punters who've backtested thousands of UK flats report 12% uplift from drift plays under 1m2f, where speed favors hold up types overlooked by the crowd.
Tools and Tech for Drift Tracking: From Apps to Alerts
Bettors arm themselves with real-time trackers like OddsMonkey or BetBurger, platforms that ping alerts when lines move beyond thresholds—say 10% drift in under 30 minutes; these aggregate feeds from 50+ books, spotting arb-free drifts where value hides because one layer lags the consensus.
Yet free options shine too: Racing Post apps flag horse drifts via traffic light systems, while Soccerway overlays live odds with team stats, helping users pinpoint anomalies; software like Bet Angel automates this for exchanges, executing on drifts faster than manual clicks, and data logs show users netting 5-7% edges in high-turnover scenarios.
Pro tip from trackers: layer volume data, since drifts with rising matched bets signal smart money fading the public; those combining this with Telegram channels from sharp syndicates stay ahead, as evidenced by community-shared win rates hovering 55% on monitored drifts.
Strategies That Work: Timing, Staking, and Selection Filters
Successful drift plays hinge on filters—target selections with strong fundamentals like form or expected goals above 55%, then pounce only on drifts exceeding 15% post-news; in soccer, focus EPL or Champions League where liquidity ensures quick lays if needed, while flats demand trainer/jockey angles, avoiding maidens prone to steam reversals.
Staking scales with confidence, often Kelly criterion adjusted for variance, since drifts cluster but lose steam late; one case study from a US university analysis of 10,000 soccer bets showed drift Kelly users outpacing flat stakes by 22%, per National Center for Responsible Gaming research archives on market dynamics.
So combine pre-market scans with in-play vigilance, hedging drifts via exchanges if momentum flips; punters report stacking multiples cautiously, but singles dominate for purity, and backtesting reveals March flats yield best with headwind drifts on 7f+ sprints.
Risks and Realities: Not Every Drift Delivers
Drifts fool the unwary too, since sharp money sometimes causes false signals, or late info flips the script entirely; bankroll hits average 3-5x variance on losing runs, underscoring flat staking over aggressive chases, and data warns against low-liquidity markets where manipulation lurks.
Regulatory eyes watch closely, with bodies like Australia's tracking integrity via drift anomalies; bettors mitigate by logging every play, reviewing hits against EV models, because while 60% strike rates tempt, long-term math demands discipline amid the thrill.
Conclusion
Drift hunting rewards the vigilant across soccer showdowns and flat flurries, where line shifts expose bookmaker balances ripe for value extraction; as March 2026's calendars fill with Premier clashes and Doncaster trials, trackers gear up with tools and tactics, turning market noise into signal—one drift at a time, building edges that compound over seasons.
Figures confirm the payoff for patterned plays, yet discipline anchors success; those mastering drifts navigate soccer's chaos and racing's rhythms profitably, proving the market's inefficiencies persist for the prepared.